
A driver scorecard rating is a single numeric score, typically on a 0–100 scale, that converts telematics event data into an objective measure of a driver's safety and operational performance. Industry guidance from GoFleet identifies 80 or higher as a commonly accepted "good" fleet score. Anything below 60 signals high risk and warrants immediate coaching attention.
Most platforms organize scores into four risk bands. Geotab's Driver Safety Scorecard uses these defaults: Low Risk (90–100), Mild Risk (75–90), Medium Risk (60–75), and High Risk (0–60). These thresholds give you a fast triage system: drivers in the Low band need recognition, drivers in the High band need structured intervention.
Three actions you can take right now:
- Check your vendor's default weight settings. Most platforms ship with generic weights that may not reflect your fleet's actual risk profile.
- Schedule a weekly scorecard review. Consistency matters more than the review's length.
- Set a target fleet average score. A concrete target score gives your program a measurable goal.
Key Takeaways
A driver scorecard rating converts telematics event data into a 0–100 safety score, and its value depends entirely on the coaching process you build around it.
| Point | Details |
|---|---|
| Definition and scale | A driver scorecard rates safety performance on a 0–100 scale; 80 or higher is the commonly accepted "good" fleet score. |
| Risk band triage | Use the four default bands (Low 90–100, Mild 75–90, Medium 60–75, High 0–60) to prioritize coaching and recognition. |
| Normalization matters | Confirm your platform normalizes scores per 100 miles or per trip to avoid penalizing high-mileage drivers unfairly. |
| Coaching cadence is the program | Weekly or biweekly structured reviews produce measurable behavior change; monthly reviews do not. |
| ROI measurement | Track accident rate, maintenance spend, fuel cost per mile, and driver retention from day one of your program. |
Table of Contents
- What behaviors does a driver scorecard actually measure?
- How is a driver score calculated from raw event data?
- What does a scorecard report contain, and how do you use each section?
- How do you turn scorecard data into behavior change?
- How do you implement a scorecard program correctly?
- Which vendors offer driver scorecards in the U.S.?
- Sample weights, risk bands, and a scoring template
- What are the most common scorecard mistakes, and how do you avoid them?
- What does research say about turning scorecards into lasting behavior change?
- A practical perspective on scorecard adoption
- Sources
What behaviors does a driver scorecard actually measure?
Driver scorecards aggregate metrics from telematics devices, dash cams, and electronic logging devices (ELDs). Each metric targets a specific risk behavior or operational cost driver. Here are the core behaviors tracked on most scorecards:
- Speeding: Detected by GPS telematics comparing vehicle speed to posted limits. Speeding is one of the strongest predictors of collision severity and directly affects insurance premiums.
- Harsh braking: Captured by an accelerometer when deceleration exceeds a set threshold (commonly 0.4g or higher). Frequent harsh braking signals following-too-close behavior and accelerates brake wear.
- Harsh acceleration: Also accelerometer-based. Aggressive acceleration increases fuel consumption and drivetrain stress.
- Harsh cornering: Lateral G-force events detected by the accelerometer. High cornering forces raise rollover risk, particularly for high-center-of-gravity vehicles.
- Idling: Measured by engine-on time with zero vehicle movement. Excessive idling wastes fuel and shortens engine life.
- Seatbelt use: Detected via the vehicle's seatbelt sensor or dash cam. Non-compliance is a direct FMCSA violation and a leading factor in fatality severity.
- Distracted driving: Flagged by AI-enabled dash cams that detect phone use, eating, or inattention. Distraction is a top cause of rear-end collisions.
- Collisions and near-misses: Triggered by high-G impact events or dash cam AI. Even near-miss data is useful for proactive coaching before an actual incident occurs.
- Hours of Service (HOS) compliance: Pulled from ELD logs. HOS violations expose the fleet to regulatory fines and signal fatigue risk.
Each metric connects to a real cost: accidents, fuel spend, maintenance, downtime, or regulatory liability. Tracking all of them together gives you a complete picture that no single metric can provide on its own.
How is a driver score calculated from raw event data?
Score calculation follows a consistent flow across most platforms, even when the underlying math differs by vendor. Understanding the steps helps you interpret your scores accurately and configure your system fairly.
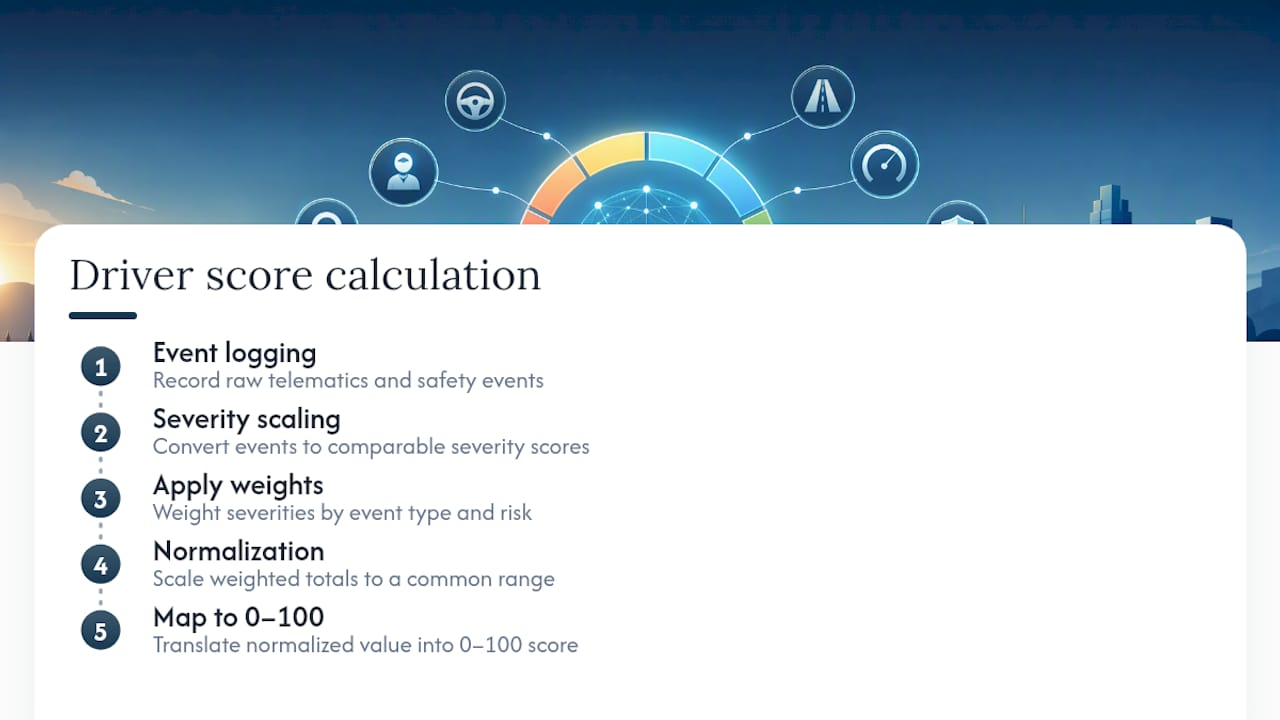
Step 1: Event logging
Every time a driver triggers a monitored behavior, the telematics system logs an event with a timestamp, location, and severity value. A single harsh-braking event at 0.6g logs differently than one at 0.3g.
Step 2: Severity scaling
Platforms assign a severity multiplier to each event. A minor speeding infraction (5 mph over) carries a lower penalty than a major one (20 mph over). This prevents a driver with one serious violation from scoring the same as a driver with ten minor ones.
Step 3: Applying weights
Each behavior category receives a percentage weight that reflects its relative importance to your fleet. The weighted event totals are summed to produce a raw score.
Step 4: Normalization
Raw event counts favor drivers who drive fewer miles. Platforms normalize scores per distance or drive time, commonly per 100 miles, so a driver covering 5,000 miles a month is compared fairly against one covering 1,000. Always confirm whether your platform reports raw counts or normalized rates.
Step 5: Mapping to a 0–100 scale
The normalized result maps onto the 0–100 scale, with 100 representing a perfect record. The score then falls into a risk band for triage.
After normalization and weighting, the platform deducts those penalties from 100, producing a sample score of 77, which lands in the Mild Risk band.
Because vendor algorithms differ, an 80 on one platform is not directly comparable to an 80 on another. Build your program around internal benchmarks, not cross-vendor comparisons.
Pro Tip: Ask your vendor whether scores are normalized per 100 miles or per trip. The answer changes how you interpret high-mileage drivers' scores and whether your coaching targets are fair.
What does a scorecard report contain, and how do you use each section?
Scorecard reports typically include a leaderboard, violation-detail tables, trend charts, and export options. Each component serves a distinct operational purpose.
Leaderboard: Ranks all drivers by score for a selected period. Use it to identify your top performers for recognition and your lowest scorers for immediate coaching. A well-configured leaderboard is also the foundation of a gamification program.

Violation detail by month: Breaks down each driver's events by behavior category and date. This is where you find the specific incidents to discuss in a one-on-one coaching session, rather than presenting a driver with only a number.
Trend charts: Show score movement over time. A driver whose score drops from 85 to 70 over three months needs attention even if 70 is not yet in the High Risk band. Trend direction often matters as much as the current score.
Export options: Most platforms allow CSV or PDF export. Exports feed insurance reporting, HR documentation, and compliance audits.
The table below shows typical leaderboard columns and how managers act on each:
| Column | What it shows | How to use it |
|---|---|---|
| Driver name | Individual identity | Identify who to recognize or coach |
| Overall score | Weighted composite (0–100) | Primary triage metric |
| Rank | Position within fleet | Drives leaderboard competition |
| Hours driven | Total drive time in period | Context for event frequency |
| Idling time | Engine-on, zero-movement minutes | Flag fuel waste and policy violations |
| Speeding events | Count or normalized rate | Prioritize for safety coaching |
| Harsh events | Braking, acceleration, cornering | Target for driving technique sessions |
| HOS violations | ELD-sourced compliance flags | Escalate to compliance officer |
How do you turn scorecard data into behavior change?
When implemented with clear KPIs and a coaching process, scorecards reduce accidents and lower operational costs. The data alone does not change behavior. The coaching process does.
A repeatable coaching workflow
- Pull weekly scores every Monday. Review the full leaderboard and flag any driver who dropped more than 5 points from the prior week or who sits below 70.
- Conduct a structured one-on-one within 48 hours. Open with the driver's score, then walk through the violation-detail report event by event. Keep the tone developmental, not disciplinary.
- Set a specific improvement target. "Raise your score from 68 to 75 within 30 days" is actionable. "Drive more safely" is not.
- Assign targeted remediation. Match the training to the violation: a driver with repeated harsh-braking events needs following-distance coaching, not a generic safety video.
- Reassess at 30 days. If the score has not moved, escalate the coaching plan. If it has improved, acknowledge it publicly.
Combining rewards and accountability
Publicly post the top 10 drivers on a leaderboard visible in the break room or via a driver app. Geotab recommends gamifying safety by recognizing top performers and using leaderboard competition to shift scorecards from punitive tools into development programs. Monthly bonuses tied to score thresholds, gift cards, or preferred route assignments all work as incentives without requiring large budget commitments.
ROI metrics to track
- Accident rate (incidents per million miles)
- Maintenance spend per vehicle
- Fuel cost per mile
- Driver retention rate
Pro Tip: Tie your scorecard program to insurance renewal conversations. Many commercial auto insurers will review telematics data during underwriting. A documented improvement in fleet average score can support a premium reduction request.
How do you implement a scorecard program correctly?
A scorecard program that launches without a clear process produces data but no results. The implementation checklist below covers the minimum commitments for a program that actually changes behavior.
Implementation checklist
- Select your metrics. Start with the five behaviors most relevant to your fleet type: speeding, harsh braking, harsh acceleration, seatbelt use, and HOS compliance are a solid baseline for most operations.
- Set initial weights. Use your vendor's defaults for the first 30 days, then adjust based on your fleet's actual incident history.
- Define your risk bands. Adopt the standard 90/80/70/60 cutoffs or customize them to your fleet's baseline score distribution.
- Choose a pilot group. Run the first 30–90 days with a subset of drivers (10–20 vehicles) before fleet-wide rollout. This lets you validate weights and coaching workflows before scaling.
- Train drivers before launch. Explain what is being measured, how scores are calculated, and what the program's purpose is. Drivers who understand the system are more likely to engage with it.
- Establish a reporting cadence. Weekly score pulls and monthly trend reviews are the minimum. Quarterly program reviews should assess whether weights still reflect your risk priorities.
- Document your privacy and disclosure policy. Drivers should receive written notice that telematics data is collected, what it is used for, and how it affects their employment. This is both a legal best practice and a buy-in tactic.
Pilot timeline and success criteria
A 30-day baseline period establishes each driver's starting score without any coaching intervention. Weeks 5–8 introduce the coaching cadence. At day 60, compare average fleet scores to the baseline. A meaningful program typically shows measurable score improvement within 60–90 days when coaching is consistent.
Driver buy-in improves when you involve drivers in setting the target score and when you share fleet-level results, not just individual rankings. Framing the program as a development tool, not a surveillance system, reduces resistance. Onboarding new drivers into the scorecard system from day one sets clear expectations before habits form.
Which vendors offer driver scorecards in the U.S.?
Several telematics and fleet management platforms provide driver scorecard functionality for U.S. fleets. Three are worth understanding in detail.
Geotab is one of the most widely deployed fleet telematics platforms in North America. Its Driver Safety Scorecard uses exception rules with adjustable percentage weights, supports multiple data sources (GPS, accelerometer, ELD, dash cam), and produces leaderboard and violation-detail reports. Geotab's open API also allows integration with third-party HR and fleet management systems.
GoFleet is a Geotab-authorized reseller that layers additional fleet management services on top of the Geotab platform. Its scorecard documentation frames the tool as a transparent number that aligns drivers, managers, and insurers, shifting safety culture from subjective feedback to objective coaching.
ServiceTitan serves primarily HVAC, plumbing, and field-service fleets rather than long-haul or linehaul operations. Its driver performance tracking is integrated into its broader field-service management platform, making it relevant for last-mile and pickup-and-delivery operations where technician driving behavior intersects with customer service metrics.
Vendor feature checklist
When evaluating any scorecard vendor, confirm the following:
- Score scale: Is it 0–100? Some platforms use different scales, which affects how you set thresholds.
- Adjustable weights: Can you change the percentage weight for each behavior category?
- Data sources supported: Does the platform ingest GPS, accelerometer, ELD, and dash cam data, or only a subset?
- Report types: Does it produce leaderboards, violation-detail tables, and trend charts?
- Export options: Can you export to CSV or PDF for insurance and HR use?
- Normalization method: Does it normalize per 100 miles, per trip, or per hour?
Scores are not comparable across vendors because each platform uses a different algorithm, weighting scheme, and normalization method. If you switch vendors, rebuild your internal benchmarks from scratch rather than assuming the new scores map to the old ones. Industry thought leadership on data-driven safety culture reinforces this point: the vendor's math is only as useful as your understanding of it.
Sample weights, risk bands, and a scoring template
The tables below give you a ready-to-adopt starting point. Adjust weights based on your fleet's incident history and operational context.
Default behavior weights
Default risk bands
| Score range | Risk level | Recommended action |
|---|---|---|
| 90–100 | Low Risk | Recognize; use as peer mentor |
| 75–90 | Mild Risk | Monitor; light coaching on specific events |
| 60–75 | Medium Risk | Structured coaching plan; 30-day reassessment |
| 0–60 | High Risk | Immediate intervention; possible duty restriction |
Adjusting weights for your fleet type
Urban and last-mile operations should increase the weight on harsh braking and cornering, since stop-and-go traffic produces more of those events and they carry higher pedestrian-collision risk. Pickup and delivery fleets also benefit from a higher distracted-driving weight if AI dash cams are deployed.
Long-haul and linehaul operations should increase the HOS compliance weight and reduce the idling weight, since highway driving produces fewer idling events but fatigue-related violations are a primary risk. Team driver operations may also need to account for co-driver handoff patterns when interpreting individual scores.

What are the most common scorecard mistakes, and how do you avoid them?
Most scorecard programs fail not because of bad data but because of bad process. These are the pitfalls that appear most often.
- The data trap. Collecting telematics data without a defined coaching cadence is the single most common failure. GoFleet's guidance explicitly warns against this: data without a review process produces no behavior change and erodes driver trust in the program. Fix it by scheduling coaching sessions before you launch the scorecard, not after.
- Using raw event counts instead of normalized rates. A driver who covers 8,000 miles a month will accumulate more events than one who covers 2,000, even if they drive identically. Raw counts make high-mileage drivers look worse than they are. Confirm your platform normalizes per 100 miles or per trip before drawing any conclusions. This is also a common CDL hiring mistake when using scorecard data in candidate screening.
- Punitive-only programs. If drivers believe the scorecard exists to discipline them rather than develop them, they disengage. Resistance, score gaming, and turnover follow. Redesign the program by pairing every corrective action with a recognition element: for every driver you coach down from High Risk, publicly recognize a driver who moved from Mild to Low.
- Inconsistent coaching cadence. Reviewing scores once a quarter and expecting behavior change is unrealistic. Industry sources recommend weekly or biweekly structured reviews for measurable results. Inconsistency also signals to drivers that the program is not serious, which reduces compliance.
- Ignoring score trends in favor of point-in-time scores. A driver at 78 who was at 90 three months ago is a more urgent coaching priority than a driver who has been stable at 72 for a year. Build trend review into your weekly process.
What does research say about turning scorecards into lasting behavior change?
The evidence on scorecard effectiveness points consistently toward two factors: coaching cadence and program design. Data collection alone does not move scores.
Industry recommendations converge on weekly or biweekly structured reviews as the minimum cadence for measurable behavior change. Programs that review scores monthly or quarterly show significantly slower improvement curves. The coaching session itself matters too: event-level specificity (discussing the exact incident, not just the score) produces better outcomes than score-level feedback alone.
Gamification accelerates buy-in. Public leaderboards, monthly recognition, and score-based incentives shift the program's perceived purpose from surveillance to competition. Drivers who view the scorecard as a fair, transparent system are more likely to engage with coaching and less likely to attribute low scores to equipment or route factors.
For ROI measurement, track four KPIs from program launch: accident rate per million miles, maintenance spend per vehicle per month, fuel cost per mile, and driver retention rate at 90 days and 12 months. Fleetio's analysis confirms these as the most reliable indicators of whether a scorecard program is producing operational value beyond the scores themselves.
Successful programs also follow a structured pilot loop: a 30-day baseline period with no coaching intervention, followed by weekly reviews and targeted training, with formal reassessments at 30, 60, and 90 days. This structure gives you defensible before-and-after data for insurance conversations and internal reporting.
A practical perspective on scorecard adoption
The biggest mistake fleets make is treating the scorecard as the program. It is not. The scorecard is a measurement tool. The program is what you do with the measurement.
Start with one metric that your fleet genuinely struggles with, whether that is speeding, HOS compliance, or harsh braking, and build your first coaching sessions entirely around that behavior. Get your coaching cadence working before you add complexity. Once drivers see that the score reflects real events and that improvement is recognized, resistance drops and engagement follows.
Scale only after the pilot group shows consistent score movement. A fleet of 10 drivers with a working coaching process is more valuable than a fleet of 200 with a dashboard no one reviews. The data will always be there. The discipline to act on it weekly is what separates programs that work from programs that don't.
Sources
The following references provide configuration details, templates, and deeper explainers for the topics covered above:
- Driver Scorecard: What it is & Why it's Important | GoFleet
- Driver Scorecards: How to Use Data to Improve Fleet Safety & Performance | GoMotive
- Driver Safety Scorecard (Geotab Support)
- Using the Driver Scorecard Report (GPS Insight help)
- Driver Scorecard Definition, Meaning, and Examples | FleetOpsClub
- Flexible Driver Scorecard Report (Powerfleet knowledgebase)
If you manage drivers for a FedEx-contracted Service Provider, the quality of your driver pool starts at hiring. Browse Ucep's employer directory to find safety-focused operators, or review Service Provider profiles to evaluate safety culture before you partner or hire. Ucep connects qualified CDL-A and pickup-and-delivery drivers with Service Providers nationwide, giving your scorecard program a stronger starting point.