
Cohort conversion, 90-day retention, cost-per-hire by source, time-to-contact, and offer-acceptance/show rate are the five recruiting metrics that matter most. Together, they show you exactly where your driver hiring budget is working and where it is leaking. Tracking them lets you shift ad spend toward sources that produce drivers who stay, and fix contact delays before they cost you a hire. The rest of this guide shows you how to measure each one and act on it.
TL;DR:
- Tracking cohort conversion and 90-day retention provides more accurate indicators of driver quality than raw lead or hire counts.
- Measuring time-to-contact and offer-acceptance rates helps identify delays that can cost you drivers, regardless of pay rate or source.
- Disqualification reasons logged at application rejection reveal patterns that can improve lead quality and screening processes.
- Focusing on high-retention sources and adjusting budgets based on retention and safety data prevents costly short-term hires.
- Implementing a consistent attribution system and structured dashboards across sources, recruiters, and retention stages is essential for reliable trucking recruitment analysis.
Table of Contents
- Core Recruiting Metrics for Trucking: What They Reveal and What to Do About Them
- How to Measure Trucking Recruitment Analytics Reliably
- Turning Trucking Workforce Analysis Into Action
- A Sample Dashboard Layout and the Formulas Behind It
- How Ucep Applies These Metrics in Practice
- Recruiting Metrics and Driver Safety Compliance
- Improving Driver Referral Program Effectiveness
- Diversity and Inclusion Metrics in Trucking Recruitment
- A Recruiting Leader's Takeaway
- Post Jobs and Track Your Recruiting Metrics With Ucep
- Sources
Core Recruiting Metrics for Trucking: What They Reveal and What to Do About Them
Most fleets track leads and hires. That tells you volume, not value. The five metrics below tell you whether your driver recruiting metrics are actually producing drivers who show up, stay, and drive safely.
1. Cost per hire, broken out by source, job type, and location. Total recruiting spend divided by hires sounds simple until you realize a blended average hides which channels are actually working. A job-board source that costs less per hire can still be your worst investment if those drivers quit in month two. Always read cost-per-hire next to retention, never alone.
2. Cohort conversion, also called lead-to-hire conversion. This measures hires that came from a specific window of leads, divided by leads generated in that same window. It is a fairer read than raw hire counts because it ties outcomes back to the exact leads that produced them, rather than crediting this month's hires to whichever campaign happens to be running now. Cohort-based tracking is what turns recruiting from guesswork into a repeatable process.
3. Time to contact and live answer rate. How fast you call a lead back, and whether a human actually answers, are leading indicators most fleets ignore until orientation numbers collapse. Drivers apply to multiple carriers at once. The first fleet to make live contact usually wins the driver, regardless of pay rate.
4. Time-to-hire across each pipeline stage. Tracking elapsed time from application to offer, not just the total, exposes exactly where candidates stall, whether that is background checks, DOT physicals, or a recruiter sitting on a lead over the weekend.
5. Offer-acceptance rate and orientation show rate. These catch the failures nobody talks about at driver meetings: candidates who accept an offer and never show up, or who show up to orientation and quit before their first dispatch.
Recruiting metrics that matter most: cohort conversion and 90-day retention consistently outperform raw lead and hire counts as predictors of a healthy pipeline, according to driver recruiting metrics research.
Retention deserves its own line item, tracked as a curve rather than a single number:
- Retention at 30 days, which flags onboarding and job-fit problems fast
- Retention at 60 days, which usually reflects pay, home time, or equipment mismatches
- Retention at 90 days, the number that determines whether a hire was profitable at all
- Retention sliced by source and by recruiter, so you know who and what to fix
Finally, log application quality and reject reasons at every disqualification, not after the fact. A recruiter who marks someone "not interested" three weeks later has already destroyed the data you needed to spot a pattern.
Pro Tip: Tag every disqualified applicant with a specific reason the moment their status changes. "Failed background check," "no CDL-A," and "unresponsive after three attempts" tell you three completely different stories about what's broken in your funnel.
How to Measure Trucking Recruitment Analytics Reliably
Bad measurement habits produce numbers that look fine and mean nothing. Here is how to build a system that holds up.
Set your cohort windows first. Decide whether you're grouping leads by application date or by hire date, and stick with it. Application-window cohorts (all leads from, say, the first two weeks of March) let you calculate a clean cohort conversion rate once enough time has passed for those leads to resolve into hires or rejections.
Attribute every lead to exactly one source. When a driver applies through a job board after clicking a Facebook ad, pick a rule (first touch, last touch, or platform of application) and apply it consistently. Mixed attribution rules are the fastest way to make your source performance data worthless.
Your ATS needs these fields captured at minimum:
- Lead source and campaign
- Assigned recruiter
- Job listing (linehaul, CDL-A team, CDL-A solo, pickup and delivery)
- Disqualification reason, logged at time of status change
- Hire date
- Orientation show status
Structure your dashboard around three tabs instead of one sprawling report:
- Marketing tab — source performance, cost-per-hire, and cohort conversion by channel
- Performance tab — recruiter scorecards showing where each person's funnel pinches
- Retention tab — cohort retention curves with reject and termination reasons split out
Smooth the noise with trailing averages. A single bad week (a recruiter on vacation, a job board outage) can make weekly numbers swing wildly. Trailing 12-week or trailing 52-week averages filter that volatility so you're reacting to trends, not blips. Building this kind of AI-enhanced recruiter workflow into your process makes the trailing-average discipline much easier to maintain without extra headcount.
Turning Trucking Workforce Analysis Into Action
Numbers on a dashboard are worthless until someone assigns an owner and a deadline to what they reveal. Here is how to translate signals into moves.
-
If the retention curve drops sharply in the first 30 days, treat it as a job-fit or onboarding problem, not a driver problem. Early churn usually traces back to a mismatch between what the job ad promised and what the role actually delivers. Recruiting and operations own this fix jointly, since pay structure, home time, and equipment condition all live outside the recruiter's direct control.
-
If a source shows low cost-per-hire but poor 90-day retention, stop celebrating the cheap hires and move the budget elsewhere. A $400 hire who quits in six weeks costs more than an $800 hire who stays a year, once you factor in re-hiring and lost freight coverage.
-
Coach recruiters on where their funnel pinches, not just on total hires produced. A recruiter with strong cohort conversion but a slow time-to-contact needs a different conversation than one who books plenty of calls but can't close offers.
-
Run structured experiments. Test two versions of a job ad against each other. Try a faster contact cadence (call within five minutes versus same-day) against a control group. Add an orientation reminder call 48 hours out and measure the show-rate lift.
-
Set operational SLAs and stick to them. A five-minute first-contact target, a documented live-answer goal, and a consistent reject-reason taxonomy across every recruiter turn subjective judgment calls into measurable, coachable habits.
Pro Tip: Review recruiter scorecards monthly, but review the retention tab quarterly. Retention data needs time to mature. Reacting to a single bad month of 90-day numbers usually means you're overcorrecting on a small sample.
A Sample Dashboard Layout and the Formulas Behind It
A working dashboard needs a headline strip and three supporting tabs, each pulling from the same underlying ATS fields.
Headline strip: total leads, total hires, cohort conversion rate, median time-to-hire, and 90-day retention rate. Anyone glancing at this for ten seconds should know if the pipeline is healthy.
Marketing tab: leads and hires by source, cohort conversion by source, cost-per-hire by source, and the top three reject reasons for each channel.
Performance tab: leads assigned per recruiter, cohort conversion per recruiter, average time-to-hire per recruiter, and 90-day retention per recruiter.
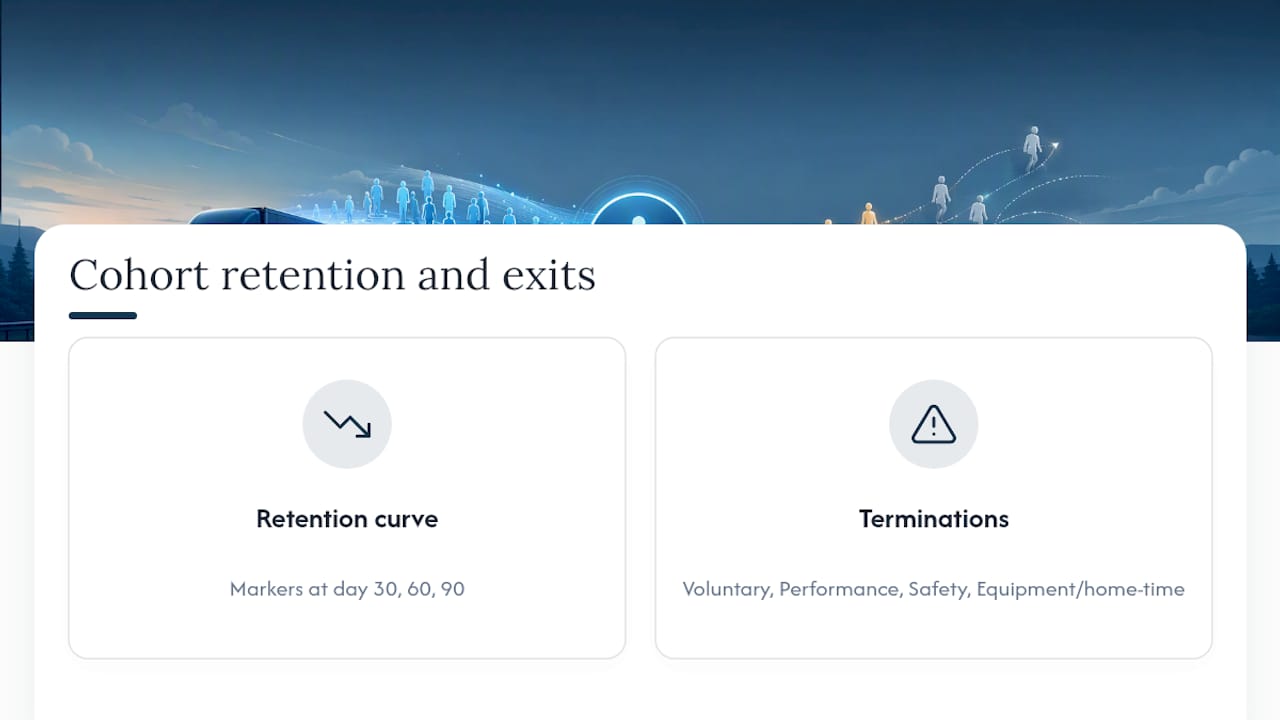
Retention tab: a cohort retention curve with markers at day 30, 60, and 90, plus a split of termination reasons (voluntary quit, performance, safety violation, equipment/home-time complaint).
These three calculations, applied consistently across every source, recruiter, and job listing, cover most of what a fleet needs to run driver recruiting like a measured operation instead of a guessing game.
How Ucep Applies These Metrics in Practice
Ucep is built for FedEx-contracted Service Providers hiring linehaul, CDL-A team, CDL-A solo, and pickup and delivery drivers, so the platform's employer directories, applicant tracking system, and driver alerts map directly onto the dashboard structure above.
A typical workflow looks like this:
- Capture the source the moment a driver applies through the platform
- Assign a recruiter and track their funnel from first contact to hire
- Log a specific disqualification reason at every rejected application
- Run a 90-day retention review by source and recruiter
- Reallocate job-posting spend toward the sources producing drivers who stay
The most common implementation mistakes are avoidable: missing source fields on manual entries, recruiters using inconsistent reject-reason labels, and slow first-contact cadences that let faster competitors grab the same driver first.
Recruiting Metrics and Driver Safety Compliance
Recruiting metrics and safety compliance are more connected than most hiring dashboards suggest. A rushed time-to-hire process that skips or shortcuts background checks and DOT physical verification to hit a speed target creates exposure that shows up months later as a safety violation or a compliance audit finding.
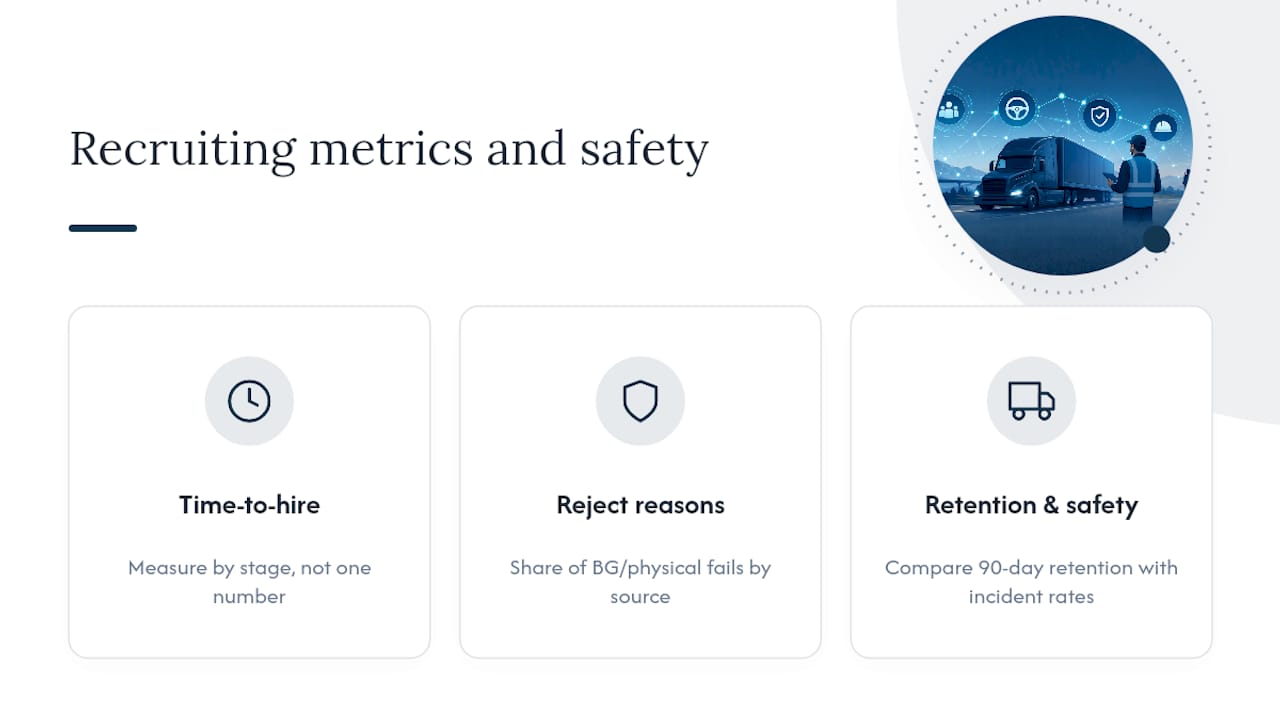
Time-to-hire should measure efficiency in scheduling and follow-up, not pressure to compress mandatory verification steps. The fix is tracking time-to-hire by stage rather than as a single number, so you can see whether delays come from slow paperwork processing (a fixable bottleneck) or from recruiters skipping steps to post better weekly numbers (a real risk).
Application quality metrics matter here too. If your reject-reason data shows a rising share of applicants failing background checks or physicals, that's a signal about where your lead sources are pulling candidates from, not just a compliance footnote. A source consistently producing applicants who fail DOT screening is expensive twice: once in wasted recruiter hours, and again in the compliance risk if screening gets rushed to keep the funnel moving.
Retention data also carries a safety signal. Fleets that see high 90-day retention paired with low safety-incident rates in the same driver cohorts have usually built a hiring process that screens for fit, not just for availability. Tracking retention and safety incidents by the same cohort and recruiter slices lets you see whether a particular sourcing channel or onboarding gap correlates with more roadside incidents, not just more turnover.
Improving Driver Referral Program Effectiveness
Referral programs consistently produce some of the best retention numbers in trucking recruiting, but most fleets run them without measuring anything beyond "did the referral get hired." Applying the same cohort and retention framework used for paid sources turns a referral program from a nice perk into a measurable acquisition channel.
Start by treating referrals as their own source in your ATS, with the same fields as any paid channel: recruiter assigned, disqualification reason if rejected, hire date, and 90-day retention status. Fleets often assume referral quality speaks for itself and skip this tracking, which means they can't tell a mediocre referral program from a strong one.
A few adjustments tend to move the needle:
- Pay the referral bonus in two installments, one at hire and one at the 90-day retention mark, so the incentive rewards a driver who actually stays
- Give referring drivers visibility into their referral's status (applied, hired, active) so the program feels engaged rather than transactional
- Track cohort conversion for referrals separately from cold leads. If referral conversion is dramatically higher, that's your signal to invest more in promoting the program internally
- Ask departing drivers in exit conversations whether they'd refer someone, and log the answer as a data point tied to that driver's cohort
Referral programs with a measurable retention bonus structure tend to outperform flat one-time bonus programs, because the incentive structure mirrors what the fleet actually wants: drivers who stay, not just drivers who sign.
Diversity and Inclusion Metrics in Trucking Recruitment
Trucking has historically drawn from a narrow demographic pool, and fleets that track diversity metrics alongside the standard recruiting numbers tend to spot untapped sourcing opportunities faster than those that don't.
The practical approach is to add demographic and background fields to the same cohort structure already tracking source, recruiter, and retention, not to run diversity as a separate initiative disconnected from hiring data. That means tracking application and hire rates across gender, veteran status, and career-changer background (drivers coming from warehouse, military, or other transportation-adjacent roles) using the same cohort windows applied to every other metric.
A few areas worth watching:
- Female driver pipeline conversion. Women remain underrepresented in CDL-A roles industry-wide. Tracking cohort conversion for female applicants separately can reveal whether the drop-off happens at application, interview, or orientation, which points to different fixes at each stage.
- Veteran hiring conversion and retention. Veterans often bring transferable skills and discipline that translate well to trucking, and many fleets find veteran cohorts show above-average 90-day retention worth highlighting in recruiting materials.
- Career-changer retention curves. Drivers coming from unrelated industries sometimes need different onboarding support than career drivers. Comparing their retention curve against experienced-driver cohorts shows whether your onboarding process serves both groups equally well.
Treating these as cohorts within the existing dashboard, rather than a separate report nobody checks, keeps diversity data connected to the retention and cost-per-hire numbers that actually drive budget decisions.
A Recruiting Leader's Takeaway
The fleets that win aren't the ones with the most leads. They're the ones who noticed a single source producing cheap hires who quit by day 40, and moved the budget before the pattern repeated for six months straight. This week, enforce one habit: log a specific reject reason on every disqualified application, no exceptions. Pair it with the common retention mistakes worth auditing next.
— Aaron
Post Jobs and Track Your Recruiting Metrics With Ucep
Ucep gives FedEx-contracted Service Providers the source attribution, recruiter visibility, and retention data this guide walks through, built into one job board instead of stitched together across spreadsheets. Employer directories and internal reviews show you which sources and terminals are actually producing drivers who stay, while the built-in applicant tracking system captures the disqualification reasons and hire dates you need for cohort conversion and retention curves.
Getting started means posting your open linehaul, CDL-A, or pickup and delivery roles and letting the platform's driver alerts route qualified candidates to your listings. Service providers weighing whether a new hiring channel is worth the cost-per-hire can review sample company profiles like Source Logistics to see how listings appear to drivers, or check the Q&A page for specific questions about setup. If faster, AI-supported intake workflows matter to your team, pairing Ucep with automated job intake tools can shorten your time-to-contact even further. Post your first listing and start building the source and retention data your dashboard needs.